A map of many views - what Google Earth and a 1500 AD chart of Venice have in common
A map of many views - what Google Earth and a 1500 AD chart of Venice have in common
A map of many views - what Google Earth and a 1500 AD chart of Venice have in common
 By Juraj Kittler, Assistant Professor of Communication at St. Lawrence University, and Deryck Holdsworth, Professor of Geography at Penn State University.
This article is part of our series: a day in the software life, in which we ask researchers from all disciplines to discuss the tools that make their research possible.
Our recent study, published last month in New Media & Society, surveyed the technical approaches adopted by Renaissance artist Jacopo de’ Barbari when he drafted his iconic bird’s-eye view of Venice in the last decade of the fifteenth century. We pointed out some important parallels between this masterpiece of Renaissance mapmaking and the current computer-supported digital representations of urban spaces.
The historical sources that we analysed indicate that de’ Barbari’s map was a composite image stitched together from a multitude of partial views. These were produced by surveyors using a technical device, called the perspectival window, and in a fashion that may be seen as a proto-digital technology. When constructing his two-dimensional image, the artist was intentionally tricking the eye of the observer into seeing a three-dimensional panoply, evoking what has later became known as virtual reality.
Current studies of virtual reality encourage us to think that such a phenomenon is unique to our own era, with its recently developed technologies, such as the electronic digitisation of images, all manipulated by and displayed on the glittering screens of computers. Yet, our study argues that such claims rely mainly on a narrow viewpoint of information theory. In so doing, it ignores the broad academic field of art history with its own studies of pre-digital virtual representation - mainly the trompe d’oeil style, where the illusion of 3D depth is created, and as used by Renaissance painters in their attempt to imitate reality.
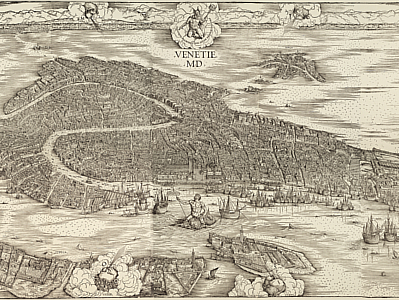
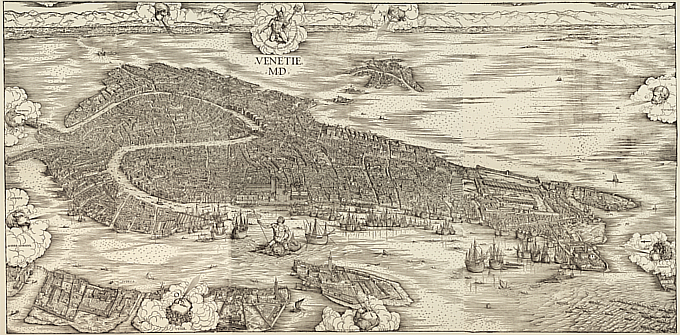 Jacopo de' Barbari, Venice (1500) – the map was printed from six original woodcut blocks totaling an impressive 1.3 x 2.8 m (4.3 x 9.3 ft).
One of the pivotal accomplishments of Renaissance art was the realism achieved by the means of linear perspective. The modern viewer does not always fully appreciate this technique because it is now well established, but contemporaries undoubtedly saw it as revolutionary. For example, the fifteenth century Florentine architect Leon Battista Alberti experimented with mechanical methods in order to capture both perspective and proportion. He suggested that a painter should cover his canvas with a rastered grid and observe his object through what he called the veil or an intersection. When working with a standing human body, Alberti suggested dividing the frame by 600 horizontal and 150 vertical lines, corresponding to 90,000 rectangles - analogous to a rudimentary 0.09 megapixel camera.
While working on his bird’s-eye view of Venice, de’ Barbari undoubtedly harnessed these ideas and used them to attain a new, unprecedented level of quality. His 1500 urban panorama consists of six woodcut matrices totalling an impressive size of 2.7 m by 1.3m. Five centuries after its completion, the map’s countless minute details continue to astound researchers.
We also know that de’ Barbari was interested in mathematics, and had experimented with the trompe d’oeil style in his paintings. In his petition to the Venetian Senate, German merchant Anton Kolb, who financially backed de’ Barbari’s project, claimed that it took its makers three years to finish the work , relying on both newly discovered surveying methods and the latest print technologies.
Although the direct evidence is rather scarce, our analysis of other similar contemporary projects suggests that the image itself was executed in four stages. For the first step, the author had to construct a basic orthographic ground plan of the city. For this purpose, he benefitted from the fact that the Venetian cityscape was flat and spatially divided, relatively homogeneously, into a system of 60 parishes, each dominated by a church with a bell tower that could have been used as a surveying point.
In the second stage, such an orthogonal plan was manipulated into a perspectival yet still two-dimensional outline of the city. In the meantime, the third stage of the project was underway. One can only assume that de’ Barbari hired a small army of surveyors to take detailed images of the most important architectural features at street level, as well as from the roofs and towers.
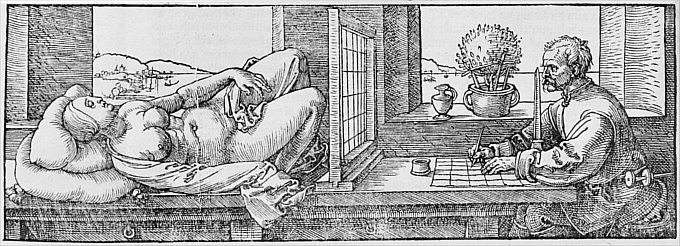 The use of the perspectival window as illustrated in Albrecht Dürer’s De Symetria Parium in Rectis Formis Humanum Corporum – the drawing is based on the author’s original sketch and was published posthumously in the 1538 edition.
Recently, Venetian architect Corrado Balistreri-Trincanato and his team have demonstrated that the enormous richness and fidelity of the map’s detail is the best indicator of this stage. A careful analysis of the map further reveals that, in the fourth and final stage, this multitude of partial images was then assembled in the artist’s studio.
De’ Barbari’s bird’s-eye-view of Venice has many historical parallels with Google Earth’s computer-generated imaging of urban spaces. While de’ Barbari invites his viewers to observe the city through the eyes of a bird flying over the Venetian lagoon, Google Earth entices its audiences to “take flight over entire metropolitan areas in 3D.” Yet it is indisputably de’ Barbari who, in addressing the technical aspects of the challenge, first showed us the way.
The result is a complex urban view that appears to be scientific and objective, devoid of any ideology, although it is in fact loaded with symbolism. This final combination displays not only the technical but also the cultural capital of a civilisation that was clearly up to such a task.