Curved display technologies for public spaces
Curved display technologies for public spaces
 By Dr Julie R. Williamson, SICSA Fellow in Multimodal Interaction at the University of Glasgow.
This article is part of our series: a day in the software life, in which we ask researchers from all disciplines to discuss the tools that make their research possible.
Public displays have the potential to dramatically change urban life, but current public displays and interfaces go unnoticed or completely ignored by the majority of passers-by. This presents a serious problem for the impact and uptake of touch sensitive displays if only a small minority of passers-by will approach these displays and discover their interactive qualities. To change the way people think about public displays, we are designing and evaluating spherical touch sensitive displays for public spaces.
The project is a collaboration between the University of Glasgow and Pufferfish Ltd. Using the cutting edge display technology developed by Pufferfish Ltd, a spherical display called the PufferSphere®, we are employing computer vision techniques to understand how people use the display and how we can improve the user experience. The approach is based on social signal processing, where software is used to automatically extract and analyse social behaviours from digital signals. In this case, we are extracting pedestrian traffic from video data as an interesting social signal for public displays.
I developed the pedestrian tracking software using an approach originally described by Wei Yan and David Forsythe from the University of California, Berkeley. My expertise is in evaluation methodologies, so it was important for me to find an open source library for the computer vision aspects of project. I developed the tracking software using OpenCV with Python and ffmpeg to work through video data. To implement Yan and Forsythe’s approach, I used OpenCV to create black and white images from the video stream, subtract the current frame from an inferred background, threshold the result to remove noise, and erode/dilate the image to produce trackable “blobs” that each represent a pedestrian in the video.
From these blobs, frame-to-frame association is determined using a Hungarian Algorithm library for Python. The Hungarian Algorithm relates valid blobs in the current frame to valid blobs from the previous frame based on distance and inferred trajectory. Together with OpenCV and the Hungarian Algorithm, pedestrian traffic can be extracted from video data with a high spatial and temporal accuracy.
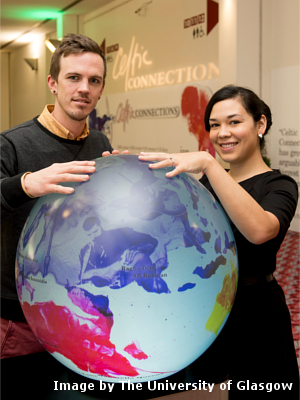
The key part of this project was to collect some real world data from a public deployment with an application on a spherical display. To achieve this, we worked with the Glasgow Royal Concert Hall and the Celtic Connections Music Festival to deploy a spherical display at the festival for four days. Using an interactive application developed by Pufferfish Ltd, we were able to create a custom Celtic Connections application for the PufferSphere® simply by configuring XML and adding media assets.
This application automatically warps graphics and touch points such that they appear correctly in a spherical projection. When working with graphics on the spherical display, the centre-point of the 1600x1600 canvas is the top-centre of the display and the outer edge of the canvas displays at the bottom centre of the sphere. Because of this, graphics are warped to make up for differing pixel densities as you move vertically down the spherical surface.
Once the application was successfully customised for Celtic Connections, we worked together with Pufferfish Ltd to bring this interaction to the festival. We deployed an A-B style test, where two slightly different versions of the applications were used on alternating days. We were excited to see very different responses to these two applications, highlighting the need for such experimental work in developing displays for public spaces. We are currently completing our analysis of the video data and touch logs in order to quantify the results of this study.