useR! 2017 conference report and thoughts on sustainable R package development
useR! 2017 conference report and thoughts on sustainable R package development
 By Andy South, Software Sustainability Institute fellow
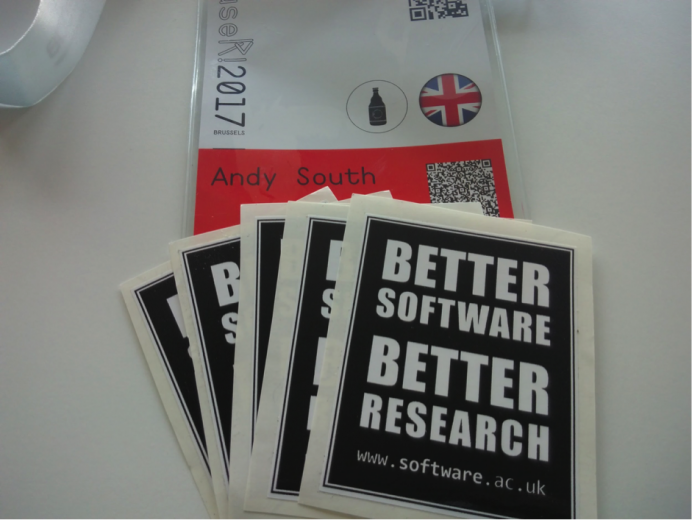
Back in July, 2017 I attended the annual R users conference (useR! 2017) in Brussels and gave a lightning talk about my thoughts on the sustainability of releasing a small R package.
I love the diversity of domains at useR and the mix of interesting use cases and useful code ideas. This was the second time that I attended useR!. The first time was in 2013 when the conference was hosted in Spain. This year, there were 1100 attendees from 54 countries. For me, the diversity of domains makes it a very accessible event. It's OK to express ignorance of what your neighbour in the coffee queue is doing. I talked to an engineer analysing measurements collected every second for hundreds of power stations across Europe, a physiotherapy student automating sending injury questionnaires to sports teams, a statistics lecturer creating a new teaching platform and running a controlled test on two groups of students. Seeing this large number of people in a conference venue is a reminder of the size and diversity of the R community, that I mostly just experience online.
The Software Sustainability Institute funded my attendance out of my fellowship fund. I've been freelance for a few years and the cost on top of the time makes it difficult to justify attending conferences. I learnt a lot, met some nice people and hope to attend again when useR! is next in Europe in Toulouse in 2019. I haven’t followed up on leads from the conference yet because I have been busy with other work; however, my last attendance at useR! led to opportunities coming up years later including my first involvement with the Institute at the data visualisation workshop in 2016.
I gave a five-minute lightning talk about a new R package I released in earlier 2017 rnaturalearthand my experiences of releasing small-scale open source software. My main points were that the sustainability of individual programming projects can be improved by a) doing less and b) getting involved with a community.
This follows my experience of creating an R mapping package, rworldmap, seven years ago, which could do a wide range of things and was probably for a while the most useable way of creating data driven world maps. With time, R programming good practice changed and I did not have time to keep the software in line with current good practice (and some of the code was fairly horrible from the start too!). It still works, but other, better solutions have been developed (e.g. tmap). Unlike a paper, releasing some software can open you up to future pressures of keeping that software working even if you are no longer funded to work in that area.
Following the Unix philosophy of DOTADIW ('Do one thing and do it well') and 'Write software to work with other things', rnaturalearth does less than rworldmap but does it better. rnaturalearth concentrates on getting data (country boundaries) which can be the basis of creating the maps. The new package allows access to these boundaries at different scales and easy subsetting by countries and regions. It allows mapping countries using different definitions of what a country is. What a country is can be more complicated than you might expect. For example, from my own parochial perspective, it allows mapping the UK as a whole or separating out England, Scotland, Wales and Northern Ireland. It also allows you to exclude far away places like the Falkland Islands, or not. Mapping France allows the inclusion or exclusion of French Guiana and islands in the South Pacific. These boundaries can then be used in other plotting packages, e.g., tmap and ggplot2. rnaturalearth is a side project for me, something to keep my toe in the R mapping community. Having people use your software is addictive but doesn't pay the bills.
For my second main point, I spoke about the benefit of getting involved with a community and, in my particular case, rOpenSci. rOpenSci have developed a community, a process and through this an ecosystem of packages for doing open science in R. I benefited from rOpenSci open peer review process. Anyone developing an R package that satisfies certain requirements can submit. rOpenSci provide an editor and seek two reviewers; the entire review process is conducted in the open on Github and is archived so that mine can still be viewed online. The review process helped me get through some tricky technical issues and I know that the community is there to ask questions if I have them in future. It was good to meet in person a couple of rOpenSci people at the conference.
In 2018, I'll need to test out how useful these approaches to improved sustainability have been. There's been an update to the Natural Earth Data boundaries and it should (fingers crossed) be relatively straightforward for me to update the R package to contain the new data.
Since July, I've been busy with other things, partly collaborating on the development and delivering of a series of week long training courses in data manipulation and spatial data display for mosquito control staff in Latin America and the Caribbean. Most participants are novices, we don't look at coding but we do help them develop good practice in data manipulation and use the excellent Free and Open Source software QGIS. We are teaching mostly operational staff rather than researchers and mostly point-and-click rather than code so this is on the boundaries of the Institute remit. However, I feel there are benefits of good practice that could usefully be translated and I hope to look into that next.