Open Data Day Cambridge

By Peter Murray-Rust, ContentMine Ltd; Rachel Spicer, EMBL-EBI, University of Cambridge; Josh Heimbach InterMine, University of Cambridge; Yo Yehudi, InterMine, University of Cambridge and Code is Science; Naomi Penfold, eLife
Image to the right: Bike thefts in Cambridge over 2017. Rendered by Rachel Spicer, using R (ggmap) + Google Maps + Open police data
Open Data Day (ODD) is an international event that runs on the first Saturday of March, started in 2010 and supported by Open Knowledge International. It aims to raise the profile of all types of open data, from government to research.
Creating our own ODD
The Open Data Day organiser’s guide recommended picking a focus. We didn’t have a huge amount of time to organise, and we knew this wasn’t going to be a large event but mainly a motivation to meet some busy friends. So we kept our ambitions small and meaningful. For Yo and Naomi, the main motivation was to use the opportunity to learn something new together (specifically, Python). So that’s exactly what we made our aim: be a welcoming space to learn something new, and learn together.
We co-organised openly via GitHub: Yo made the website and secured sponsorship, Naomi arranged the venue and catering, and together we created the content for our site and the Open Data Day in Cambridge.
On the day
Open Data Day was the Saturday after Storm Emma, which caused travel chaos in the UK. A few sign-ups sensibly dropped out due to the snowy conditions and in the end we were a small group: Rachel Spicer and Peter Murray-Rust arrived in the morning, and Josh Heimbach joined us for the afternoon.
First, we decided what to work on. Peter was keen to use some WikiData, Rachel just wanted to learn and possibly use Kaggle datasets, Yo had intended to make a web app of traffic data, to build on and update a previous project, and Naomi wanted to make her first Jupyter notebook. We settled on investigating bicycle theft using data openly available from UK police. Several in the room had fallen victim to bike theft, Peter very recently, and we were curious to map the data to see if there were location hotspots, and understand patterns of reports by month and police outcome.
To begin the task, we downloaded CSVs of all crime reports in Cambridgeshire constabulary, and reviewed the data as a group before taking on different wrangling and visualisation tasks. Since the data was provided as separate CSVs per month, and had columns and crime types that we didn’t need, Rachel combined the files and stripped out the extraneous bits.
Mapping crime reports
Yo investigated making a webapp for this using Python, but it required a lot of infrastructure building, and decided there probably was not enough time. Rachel looked at making it in Python, but similarly decided it was a bit of a stretch. In the end, Rachel produced a static map in R so we could see the data by the end of the day.
Peter focused on text extraction, producing a wordlist common to bike theft stories scraped from the web.
Summary analyses
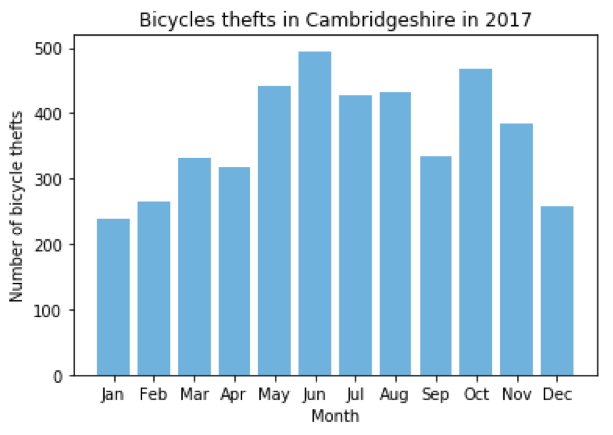
After abandoning the mapping web app idea, Yo joined Naomi to plot bike theft report frequency according to month, which resulted in a bar plot - but perhaps due to their lack of familiarity with Python, the months in the bar chart ended up in alphabetical order rather than month order! Naomi worked that out after the event, but thinks there’s a better solution to be found still — part of the the joy of learning!
What we learned
We really didn’t spend too much time organising (we didn’t have that luxury!), yet we still achieved our aim. This goes to show it is possible to wrangle a small event with not much overhead and get something from it.
Opting to work together on the same project as a small group was a really good decision in hindsight. It meant we ended the day with outputs that we could all feel proud of, and that were substantial enough to share beyond the room. It also gave us a great central focus through which to share and discuss and learn together.
It was also important to have this shared focus, and a simple dataset and aim, as none of us were really comfortable with Python. We channeled our energy into learning by deliberately pushing ourselves out of our comfort zones. As Peter said, “We pulled ourselves up by bootstraps learning dataframes and data structures”.
What we did have, however, were techniques and experience solving the same problems in other languages. Peter introduced us to rubber ducking, where one person thinks through their problem out loud and the rest look on. Often thinking out loud is enough to come to your own solution, and if not then the onlookers can interject with suggestions. Rachel knows R well, and so was very handy for finding solutions or analogous programs in R, from which we could then find a solution in Python. Several bugs were fixed by combination of rubber ducking and knowledge of other languages.
Other bugs were fixed virtually — Naomi woke up on Sunday morning to a list of tips to improve the notebooks and code, and some pull requests, from Achintya Rao (CERN + UWE).

A new beginning
We really enjoyed the data, and each got so much from the friendly study group environment. Naomi, Yo and Rachel may have plans to make this more regular. If you’re in Cambridge and interested in a regular evening study group on Python, let Naomi know (@npscience on Twitter/gitter or email n.penfold@elifesciences.org).
Thank you to the Software Sustainability Institute for sponsoring the event — you kept us well-fed and watered! Thanks also to eLife for providing the venue. And thanks to Peter for gifting kangaroos to Yo and Naomi <3.
All images are courtesy of Yo Yehudi, unless otherwise stated.