Quick and dirty analysis of the software being used in research: Python, Matlab and R
Quick and dirty analysis of the software being used in research: Python, Matlab and R
Posted on 12 August 2016
Quick and dirty analysis of the software being used in research: Python, Matlab and R
 By Simon Hettrick, Deputy Director.
Over the last couple of years, we’ve had occasion to ask people about the software they use in their research. We’re about to start a long-running survey to collect this information properly, but I thought it might be fun to take a rough look at the data we’ve collected from a few different surveys.
It would be easy to survey people if there existed a super-list of all possible research software from which people could choose. But no such list exists. This raises the question of how many different types of software do we expect to see in research? Hundreds, thousands, more? The lack of this list is rather annoying, because it means we have to collect freeform text rather than ask people to choose from a drop-down list. Free-form text is the bane of anyone who collects survey data, because it takes so much effort to clean. It is truly amazing how many different ways people can find to say the same thing!
I collected together five of our surveys from 2014 to 2016, which relates to 1261 survey participants. From these, we collected 2958 different responses to the question “What software do you use in your research?”, but after a few hours of fairly laborious data cleaning (using Open Refine to make things easier) these were boiled down to 1097 unique names. In other words, the people in our surveys reported using 1097 different pieces of software to conduct their research! With that thought in mind, I've been looking at the 20 staff we have at the Institute and thinking “we're going to need a bigger boat”.
You can see the cleaned list of responses and their popularity on this google sheet and in Zenodo (10.5281/zenodo.60276).
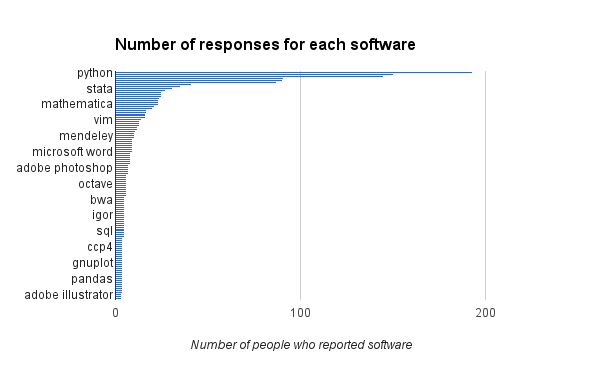
Although we received many responses, there is a significant focus on a relatively small number of packages. Of the 2958 responses, only 35 software packages were reported by more than ten people. The top five responses account for almost a quarter of all responses (665 out of the 2958). Popularity drops off very quickly (see below): 304 software packages were reported by more than one person, the other 2654 were each reported by only one person.

This was a quick bit of analysis conducted during a few free hours at a hackday and on the flight back home. I’m not going to pretend that it was scientifically rigorous (but the study we are about to launch will be). With those provisos in mind, what can we say about this data?
The thing everyone wants to know, who’s the top dog in research software?
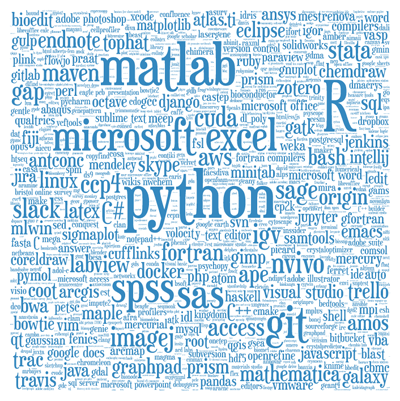
It’s Python! Followed closely by Matlab and then R. When we looked at our survey of researchers at 15 research intensive universities, we found Matlab at the top of the list, but once we combined this with the data from the RSE survey, there was a shift to Python. It’s an unscientific combination though (there were more RSE responses than researcher responses). But I think it’s safe to say that the Python, Matlab and R are likely to be the most frequently used software in academia.
Git, SPSS and Excel take the next three places and this says something about the range of people we surveyed. To see Git so high up on this list only 8 years after it was released says something about the rapid ascent of this software (or perhaps, it says something about the deep love that is felt for Git by the RSE Community). The popularity of SPSS indicates that social scientists and other researchers who care about stats make up a significant proportion of the responses.
There is a tendency (a snobbery even) to see Excel as “not software”, but I’ve always disagreed with this point of view. I was originally an experimental physicist and Excel was my go to tool for quick analysis. Want to roughly locate the peak in the data? Want to see how these variables are related? Can't do mental arithmetic and need to multiply 5 by 23? Excel was the tool I used. Let’s be clear: there are far, far better tools out there for transparent, repeatable analysis. But we have to accept that many researchers like the accessibility of spreadsheets, and being too uptight about them means we risk alienating this significant group of researchers (and if we stay friends with them, we can entice them to try out new and better tools).
There is a big drop off (around 50%) in the number of people reporting use of the next three software packages: Nvivo (for qualitative analysis), ImageJ (Java-based image analysis) and Stata (data analysis and more stats), so I’ll stop my analysis here.
I’ve been working with "researchers who use software" since 2006, so I didn’t expect to be too surprised by the results of this analysis. However, I was both surprised and slightly terrified that over 1000 software packages were reportedly in use by the just over 1000 researchers who responded to our surveys. At least none of the top responses came as a surprise to me, we’ve seen a lot of Python, Matlab and R. I am heartened that an open-source, programming language has taken the top slot but, as described above, we may see a change in the top dog when responses from RSEs make up a smaller proportion of the overall responses.
We will soon be launching a long-running survey to collect this data properly. Keep an eye on our blog and Twitter for more information.

