
Researchfish®: what can it tell us about software in research?
 By Simon Hettrick, Deputy Director.
Researchfish® allows researchers to record the impact of their research outside of the standard metric of how many papers I have written. These outcomes, as they are called, cover publications, but also collaborations, events, awards and other metrics including - and of most interest to me - software.
Researchfish® was established with the support of MRC and initially focused on collecting outcomes from medical research. It has since been adopted by a broad range of funders, including the UK’s seven Research Councils. I recently had an interesting talk with the EPSRC’s Louise Tillman about what these outcomes might say about research software in the UK and, thanks to her, a week later I found myself in possession of a spreadsheet containing the research outcomes related to software for EPSRC researchers.
Just having the outcomes is pretty exciting, but to make things more interesting, I decided that I would write the analysis code myself. I’m not a software developer, but it’s getting progressively more difficult to stay that way when I spend my life surrounded by Research Software Engineers. Hence this post not only reports an investigation into Researchfish®, it also covers my first foray into data analysis using Python. Of course, this is the Institute, so everything’s open, which means all that “don’t worry about the state of your code, it’s good enough to publish” advice I’ve been giving over the years is coming home to roost. Suffice to say, that if software is art, then see this as my first attempt at finger painting.
Software used in this analysis is available at DOI/10.5281/zenodo.250494.
Inevitably, there are some limitations to the analysis. See the end of the post for more details.
How much software was recorded?
Researchfish® holds 851 software outcomes for EPSRC researchers relating to the period 2012-2016. We can put this into context with help from the EPSRC’s report Research outcomes 2016, which states that almost 100,000 publications were recorded during the period 2009-2016.
Some researchers don’t use software (a minority, but they do exist). Many use software, but don’t write it themselves, so it doesn’t count as a research outcome. But do EPSRC researchers really generate publications at a rate a couple of orders of magnitude greater than they write software? I doubt it, because a significant number of those publications will rely on home-grown software to produce their results. It’s unlikely that the 851 software-related research outcomes are reflecting real-world practices. It’s much more likely that the disparity between software and publications reflects the well-established culture of recognising publications as a research outcome, but not recognising software as such. Another factor is the relative ease of recording publications in Researchfish®: some are recorded automatically which considerably improves data collection rates.
Which university records the most software?
There are 165 universities in the UK, and of these 36% (i.e. 60 of them) have recorded a software outcome. That’s a good show for a relatively new practice.
Not all universities are equal. Only three universities have recorded more than 40 software outcomes. Imperial takes the lead with 66, the University of Aberdeen takes second place with 44 and UCL has 43. Following the top three, there’s a group of 8 universities (including my own in Southampton) with more than 20 recorded software outcomes. After that, outcomes drop pretty low, with 45 universities (roughly 25%) recording 10 software outcomes or fewer.
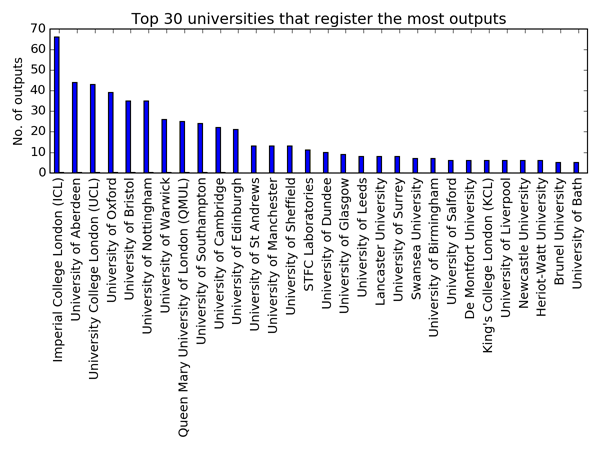
Why do some universities record more software as a research output than others? Is it down to the EPSRC grants they are reporting against? The University of Aberdeen’s position is largely down to the dilligence of the Rural Digital Economy Research Hub, which is responsible for recording 73% of the university’s software outcomes! There is no such dominance by a single group at Imperial or UCL, where most research groups record 1-3 software outcomes.
Some universities may conduct research that is less dependent on software, but it would seem unlikely that a significant difference in software use exists across the universities in this list, and certainly I’d expect the top ten universities to be fairly similar. There’s the obvious issue of size. Imperial and UCL are big universities with researchers who pull in a lot of funding, but so are many of the universities that record fewer software outcomes. Maybe there's just a stronger culture for recording outcomes, or better guidance, at the top universities on this list? It’s something that will require further investigation. If you’re from Imperial, Aberdeen or UCL and think you can explain it, please comment below or get in touch.
How open is research software?
The outcomes allow us to gain some insight into the prevalence of open-source software in research, but it’s not as simple as one would hope.
Up to this point, when I say Software I’m actually referring to four different types of software-related outcome that can be recorded in Researchfish®: e-Business Platform, Grid Application, Software or Webtool/Application. However, licensing information is collected only for Software outcomes. Hence, in this section on licences, when I say Software I mean specifically Software outcomes and not outcomes related to e-Business Platform, Grid Application, or Webtool/Application. Simple, right?
Of all the recorded software, 79% is licensed under an open-source licence. That’s a great statistic if you care about reproducibility. A further 13%, I must assume, is recorded under a closed-source licence (the researcher answered "No" to the question “Is the software open source?”). This means that 7% of the software was recorded without answering the licence question. It seems odd to me that someone who is happy to go through the process of recording an outcome in Researchfish® would skip the open-source question if they knew the answer. I feel that a good proportion of the 7% of software that was recorded without answering the open-source question is simply not licensed.
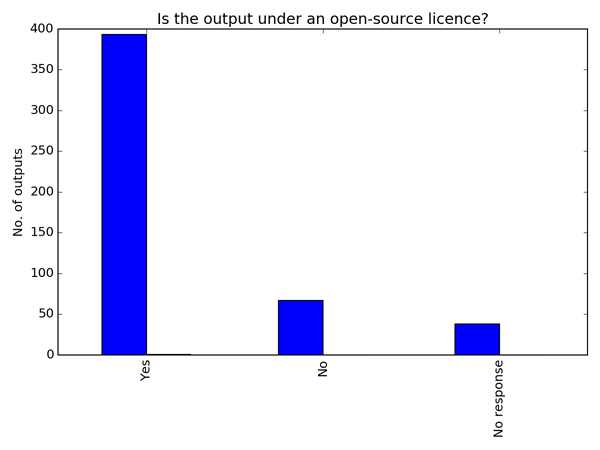
Without a licence people don’t know what they can do with your code, so it cannot be shared. Licensing code is easy (well, pretty easy). Talk to your IP department, determine who owns the code and get advice on which licence to use. There are a number of good guides on licensing, including our own.
With a bit more time, I hope to find out more about the 7% of software that was recorded without licence details.
Where is the software stored?
Researchers are asked for a URL to locate their software, which allows us to investigate changing tastes in repositories and provides a means to take this study further.
First of all, 597 of the outcomes were recorded with a URL. This means that 254 of them, or 30%, are provided without means to access the software. Even if the software is closed source, and only 13% of it purports to be, it’s possible to link to a binary. It’s not necessarily a bad sign that there’s no URL associated with the software: it could be stored in a local repository that’s inaccessible to the outside world. However, things aren’t so rosy if the lack of a URL indicates that the only version of the code exists on a student’s laptop somewhere. This needs further investigation.
We’re agnostic to technology at the Institute. In general, when it comes to storage, we’re happy as long as your software is stored under version control. For that reason, I’m happy to see Github is the most popular location for software. Github is associated with 137 software outcomes, or 23% of the software recorded with URLs. This is over five times more than the second-most popular repository, CRAN (25 outcomes). If we consider that CRAN has been around since the late 90s and Github was only launched in 2008, then Github’s lead starts to look convincing.
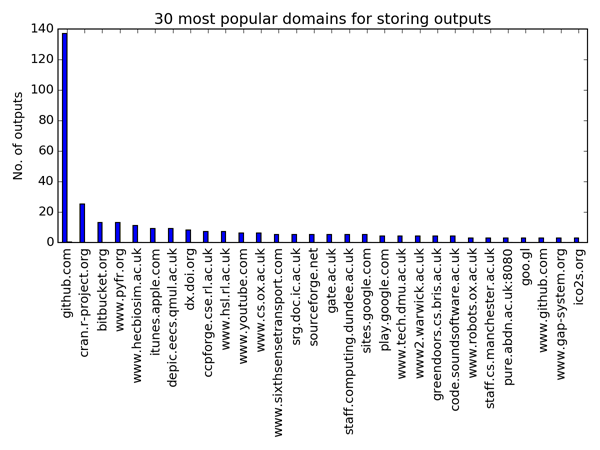
What strikes me is the range of locations in which software is stored. There are 267 different hostnames within the URLs provided by the researchers. Other notable repositories, like bitbucket (13 outcomes), CCPforge (7 outcomes) and SourceForge (5 outcomes) are in the top 20, but don’t boast many outcomes in total. Many of the hostnames appear to relate to a project’s own website, with 34% of the URLs related to a single software outcome.
It’s alive! No… wait a second
To get an idea of the status of the repositories, I pinged the 597 URLs that researchers provided to check whether they are alive. This statistic comes with a pretty major proviso: I only checked if the URL did not throw an exception when the header is requested, I did not check whether it’s possible to access the software (or, indeed, that the URL has anything to do with software or the person who recorded the software).
When pinged, 548 of the URLs were alive and 54 were not. This means that about 10% of the URLs provided by researchers over the last five years did not respond. In a perfect world, all of the URLs would be viable, but I have to admit that I’m happy that so many are accessible. The URLs need further investigation, especially to see whether the software is accessible, but this is something for later.
What now?
This first pass at the Researchfish® data has raised a few questions. Why do researchers at some universities appear more willing to record outcomes than others? Are 7% of the outcomes really not licensed? What licences are being used? Where can we find the software from the 30% of outcomes that were provided without a URL? Can we actually get our hands on the software at the live URLs? And the big question, of course, do these outcomes in any way reflect the software that is being developed by researchers?
Throughout this year I’ll take a look at answering some of these questions, which should shed light on the use of research software in the UK (and improve my knowledge of Python). I’ll also look to normalise some of the outcomes against size of the university, or the amount of funding it attracts. I’ve just downloaded the data for all Research Councils, so my next post will take a look at how outcomes vary in relation to research funder.
Ultimately, I’m interested in developing advice that will help more researchers record their software outcomes and, I hope, make them available to others.
Limits to this study
This analysis is conducted on software outcomes recorded by EPSRC-funded researchers: the important word is recorded. There’s a lot of software out there in the wild, but if it isn’t recorded in Researchfish® - and I suggest that the vast majority is not - it doesn’t exist as far as this analysis is concerned.
I was asked not to release the data that I used in this study. There are two options if you would like to reproduce the analysis. The first is to go to Gateway to Research and download the appropriate research outcomes for yourself, the second is to wait for my second post on this subject which will include the data relating to research outcomes from all Research Councils.
The EPSRC started using Researchfish® in 2014. Data for the period 2006-2014 was imported from the previous systems EPSRC used for recording research outcomes. I was advised that the period 2012-2016 held the most reliable data for software-related outcomes, so this analysis is limited to these years.
There has only been one data collection during 2016 (in February-March), so there are relatively few research outcomes recorded for 2016.
Although I’ll refer simply to Software throughout this article, I’m actually talking about the four Types of Tech Product (in the parlance of Researchfish®) which represent software, namely: Software, Grid Application, e-Business Platform and Webtool/Application.
Researchers will occasionally record a research outcome against multiple projects, so I was advised to remove duplicates to prevent double counting. Researchfish® does not provide unique IDs (at least in the data that’s available to me), so the easiest way to find duplicates is to locate outcomes with identical entries in the Tech Product field. This field represents the user-provided name of the software, so it’s unlikely that accidental duplication would occur.
Acknowledgements
I would like to say a big thank you to the EPSRC's Louise Tillman for the talk that began this investigation, for supplying the research outcomes, and for reviewing this article.
I would like to say thank you to the EPSRC's Ben Ryan for sharing his in-depth knowledge of research outcomes and for his help refining my analysis.
Finally, thank you to Olivier Philippe who pulled the short straw and got lumbered with teaching me how to set up Python virtual environments.