Distribution of scores
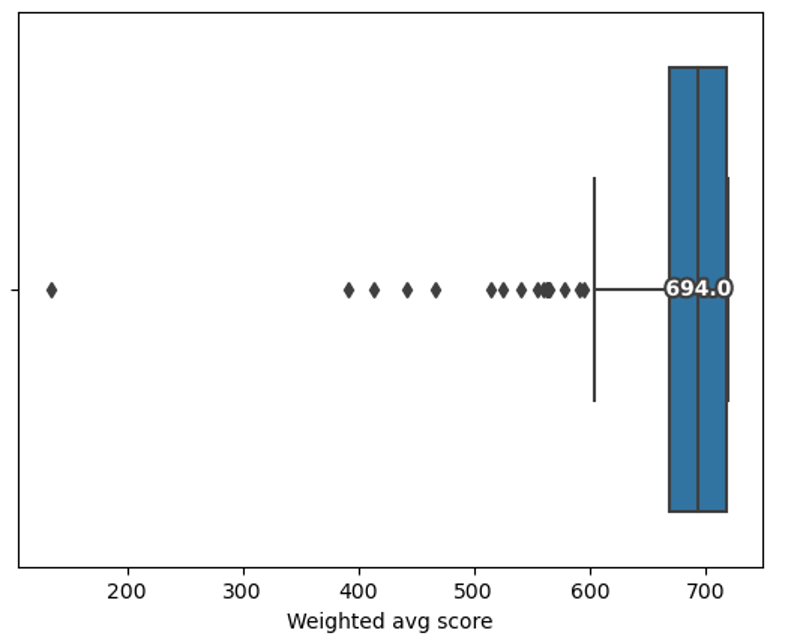
As can be seen in the boxplot above, the overall fit to scope of the applications was very high, with the median score being 694 and the mean being 683. This meant that a very high number of applications had scored highest marks across all key criteria (126 applications), and many others only dropped a grade in one key criterion or a small number of additional criteria (further 122 applications). For comparison, an EoI which was assessed as “mostly in scope” across all categories would have scored 540: only seven EoI’s scored less that.
Reviewer assignment
Seven reviewers assessed the EoIs: members of the RSMF programme team alongside two independent reviewers who were external to the fund and its related institutions. Reviewer pairings were rotated across different combinations to help identify any potential systematic differences in scoring. To manage conflicts of interest, external reviewers assessed all EoIs where the RSMF team had a conflict, as well as a sample of unconflicted EoIs.
Analysis of EoI criteria
The following figures show the unweighted scores for each criterion across all the applications, showing where EoIs may have lost points.
Software criteria
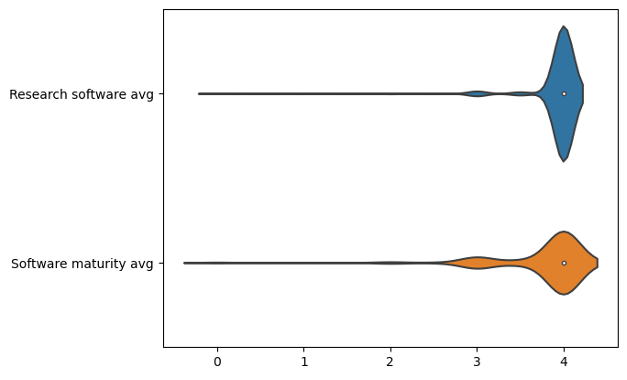
Both software-related criteria were key criteria and, in general, most applications met these criteria fully. There were a small proportion of applications that did not clearly demonstrate that there was a stable or production release.
Team Criteria
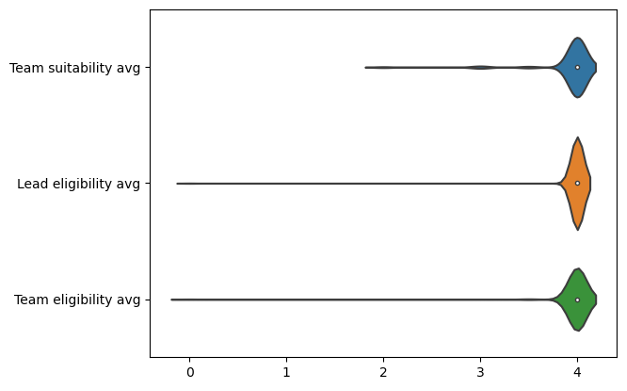
All team-related criteria were key criteria, but in this case, there were almost no applications which did not demonstrate these fully.
Benefit criteria
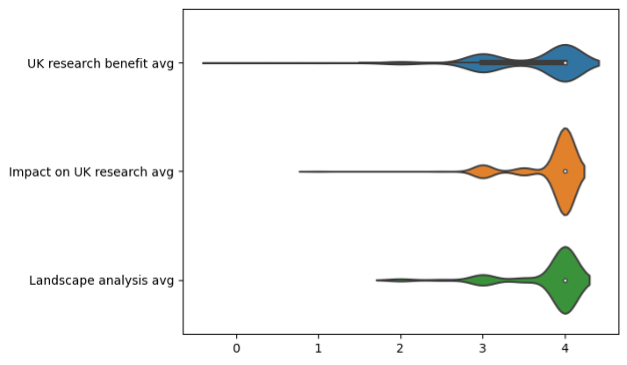
The benefit-related criteria demonstrate a slightly wider range of scores. In particular, the key criterion of demonstrating UK research benefit is the first where we see a significant number of applications which only “mostly” meet the criterion.
There were a few reasons for this, including:
- Not providing clear evidence of use in research outside of the development team. The highest-scored applications provided references to published peer-reviewed research outputs that identified the role that their software had played.
- Insufficient evidence of use in UK research. Some EoIs demonstrated strong international user base but failed to clearly demonstrate that their software is also being used in the UK.
In terms of the landscape analysis, in general most applications did an excellent job of considering the other related software in their area. Where applications were scored lower, it was because:
Activities criteria
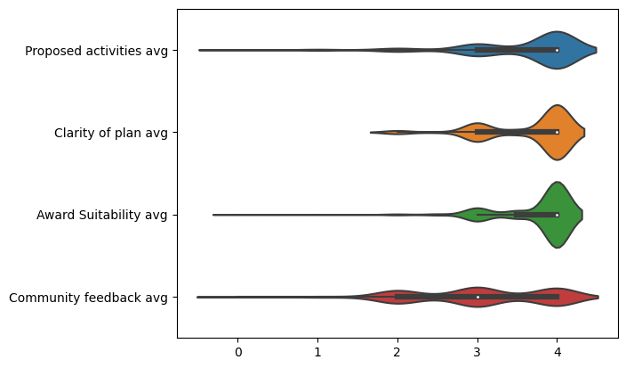
The activities-related criteria showed the greatest variation in scoring, with proposed activities being the key factor. Applications tended to score lower where:
For the clarity of plan criterion, lower scores typically resulted from:
Objectives that were not clearly defined.
A lack of alignment between objectives and proposed activities, with some activities not contributing directly to stated objectives, or objectives not being supported by the planned work.
For award suitability, the main reason for some applications scoring lower was that the description did not fully justify why a large award was necessary or, in a few cases, the proposed work being overly ambitious for a small award.
The community feedback criterion had the most scoring variance. For this, the reviewers looked for evidence that the team and/or the software project had put in place mechanisms for ensuring two-way feedback with the user community. In lower scoring applications, these mechanisms were only one way, e.g. a broadcast mailing list or documentation. The highest scoring applications offered ways for users to raise issues or feature requests, or even to create or improve ways in which the community can contribute to the software development roadmap.
Setting cutoffs
Because so many EoIs fully met the criteria, we wanted to make sure our process for selecting which to take forward was as fair and transparent as possible. To do this, we created three pools:
Pool 1: applications invited to submit a full proposal.
Pool 2: applications not taken forward.
Pool 3: applications entered into a lottery for any remaining places, depending on how many could be accommodated from Pool 1.
When setting the boundaries for these pools, we looked at two things: (1) the score that indicated an EoI had fully met all of the key criteria, and (2) whether there were clear “natural breaks” in the scores.
The first clear break was between 695 and 703, with no applications falling in that range. We therefore set the cutoff at 700, meaning that 140 applications scoring above 700 were placed in Pool 1 and invited to proceed.
The next gap appeared between 670 and 677. 122 applications scoring between 677 and 700 were therefore placed in the lottery pool (Pool 3). These applications generally met most—but not all—key criteria, and some additional criteria as well.
The remaining 98 applications formed Pool 2, which was not taken forward. Their scores were distributed as follows:
39 between 660 and 670
28 between 630 and 660
14 between 600 and 630
12 between 500 and 600
5 below 500
Breakdown of EoIs
Size of award applied for by career stage of lead
| | Large % > 700 | Large % 670-700 | Large % < 670 | Small % > 700 | Small % 670-700 | Small % < 670 |
| Early | 26.7% | 31.3% | 24.1% | 28.9% | 34.4% | 37.5% |
| Mid | 41.9% | 37.5% | 37.9% | 50.0% | 40.6% | 33.3% |
| Established | 29.7% | 29.7% | 36.2% | 18.4% | 21.9% | 25.0% |
| Not specified | 1.8% | 1.6% | 1,7% | 2.6% | 3.1% | 4.2% |
It appears that for both large and small awards, mid-career leads were more likely to have been highly scored. This could be because they were more likely to have had enough recent and relevant experience of working on the software, but we do not have the evidence to prove this hypothesis.
Breakdown by general research area
| Large (total EoIs) | Large % > 700 | Large % 670-700 | Large % < 670 | Small (total EoIs) | Small % > 700 | Small % 670-700 | Small % < 670 |
Physical Sciences | 77 | 40.6% | 44.8% | 50.0% | 97 | 59.2% | 48.4% | 43.8% |
Engineering & Technology | 55 | 28.1% | 32.8% | 36.0% | 51 | 28.9% | 23.4% | 29.2% |
Computer Science and Mathematical Science | 91 | 42.2% | 58.6% | 60.0% | 88 | 59.2% | 37.5% | 39.6% |
Life Sciences | 76 | 57.8% | 32.8% | 40.0% | 74 | 32.9% | 53.1% | 31.3% |
Social Sciences | 31 | 10.9% | 15.5% | 30.0% | 31 | 5.3% | 28.1% | 18.8% |
Arts and Humanities | 15 | 6.3% | 5.2% | 16.0% | 15 | 3.9% | 15.6% | 4.2% |
Other | 23 | 12.5% | 15.5% | 12.0% | 19 | 7.9% | 10.9% | 12.5% |
(Note: This table shows the percentage of EoIs in each pool that tagged a particular subject area. The total percentages add up to more than the 100%, as applicants could tag more than one area)
The overall split of general subject areas shows that there was not a significant difference between large awards and small awards in the split of EoIs submitted. However, there are a few takeaways when looking at how EoIs from each area were scored.
For large awards, the main takeaways are:
The Life Sciences appear to be more highly represented in the top scoring pool. This could be because there have traditionally been more dedicated routes for funding large scale research software development for the life sciences.
The Social Sciences and Arts and Humanities are underrepresented overall and show a clear drop off. There are some general-purpose tools widely used in the social sciences that are also tagged with Computer Science and Other, which were more likely to be high scored. We will endeavour to increase advertising to relevant communities, and to see if there are other means to encourage high-quality applications.
For small awards, the main takeaways are:
The Physical Sciences and Computer Science and Mathematical Sciences have been proportionately higher scored.
Social Sciences and Arts and Humanities have been proportionately lower scored; however, this is on a small number of applications. Again, we will look to see how we can encourage submission of more high-quality applications from these areas.
Ethnicity and Disability
It was not possible to look at aspects relating to ethnicity, as the EoI leads were overwhelmingly White British or other White background. There was no significant difference between the three pools with regards to whether leads indicated that they were disabled or not.
Lessons learned and next steps
This first round showed both the strength of the community and the challenge of running a broad, competitive scheme. In future, we aim to be clearer about what types of projects we are seeking, encourage more applications from underrepresented disciplines, and share feedback more quickly. We will also look at improvements to the infrastructure and process that will allow us to provide more detailed feedback, however it is extremely difficult to provide individual feedback when so many applications are scored so highly. The fact that the first round was so heavily oversubscribed highlights just how necessary this type of initiative is and evidences the need for more programmes like it to support the sustainability of research software.
We plan to run another round for small awards towards the end of the year and will continue making the case for more funding in this area. For those not taken forward this time, we hope this analysis helps strengthen future applications.