Using Python to double check your work
Using Python to double check your work
 Calculating table by Gregor Reisch:
Margarita Philosophica, 1508.
Public domain.
.png)
By Peter Inglesby.
This blog post has been written as an introduction to Python ahead of the panel discussion: Do we have the right tools for research (5 Nov 2021, 2pm GMT). The panel is part of the Research Software Camp: Beyond the Spreadsheet.
This work is licensed under a Creative Commons Attribution-NonCommercial-ShareAlike 4.0 International License.
Introduction: a problem with spreadsheets
Spreadsheets are a wonderful tool for exploring and analysing data. Spreadsheet software is available on almost any computer, and there are now powerful spreadsheet programs available online. Sharing a spreadsheet is as easy as sharing a file or a link. Getting started is easy and yet there is almost no limit to the complexity of the analysis you can perform. All of these factors, and more, explain the enduring popularity of the spreadsheet across every imaginable domain, including academic research.
But analysing data is hard and requires discipline and accuracy. A single mistake can propagate through an analysis, leading to erroneous conclusions. This includes analyses done using spreadsheets, and several studies have found that the majority of spreadsheets include errors.
The European Spreadsheet Risks Interest Group collect news stories about the impact of mistakes in spreadsheets, including miscounting election results, misreporting financial results, mis-stating the case for austerity, delaying the opening of a hospital, and losing Covid test results.
Of course, the prevalence of spreadsheet horror stories is in part a reflection on the popularity of spreadsheets, and writing buggy software is easy in any language.
I would be the last person to claim their software is bug free. But in my experience, bugs in spreadsheets are particularly hard to pin down. I think there are a number of reasons for this, but what I'd like to focus on today is the lack of tooling to support detecting errors in spreadsheet analyses, and how this contrasts with the Python ecosystem.
Introduction: about me, about this blog post
First, a little bit about me. I'm a software engineer at the DataLab at Oxford University. We're a mixed team of researchers, clinicians, and engineers, and as well as producing traditional academic outputs, we also build interactive data-driven websites, such as OpenPrescribing, for exploring prescribing in primary care across England, and the OpenSAFELY framework, for carrying out research against sensitive health data in a way that respects patient privacy.
I've written this blog post for the Software Sustainability Institute's Research Camp "Beyond the Spreadsheet". The purpose of this post is to explore some of the tools that exist in the Python ecosystem to give us confidence that our analyses are correct. This is not a Python tutorial: plenty of those already exist, and I have included links to some resources for learning Python at the end.
This blog post contains quite a bit of code, but this is not the important bit. It is my intention that you do not have to be able to read Python in order to get something out of this post. Instead, you should focus on the techniques that I discuss, the kinds of bugs that these techniques can find, and the amount of effort required to find them.
If you read just one section, read The value of tests.
Example: a spreadsheet with a problem
Before we take a look at Python, I want to show you a spreadsheet that contains data about the cumulative number of events of different types from two different sources.
(This example is based on some vaccine coverage work we did earlier this year: we had data from two electronic health record systems, which gave us the cumulative number of people given each type of vaccine by each day.)
There are two sheets, A and B, one for each source. Each sheet contains a table with one row per day and one column per event type. The values in each table are the cumulative number of events seen by each day, for each event type.
The third sheet should show the cumulative number of events per day, aggregated from both sources.
However, there's a problem!
We would expect the cumulative number of events per day to always increase, but when we look at the graph, we see this is clearly not the case.
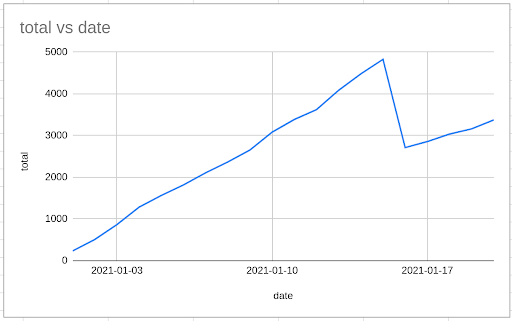
Take a careful look at the formulas in the spreadsheet, and see if you can work out where the problem has crept in.
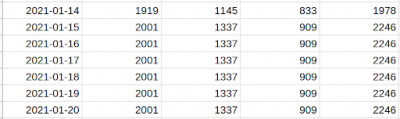
You might notice that in sheet A, we have data going up to 20th January, while in sheet B, we only have data going up to the 15th.
So when we say that the value of Combined!B17 is A!D17 + B!D17, we're just taking the value of A!D17, since B!D17 is empty.
I can fix this by creating five new rows in sheet B, each with the same values as the last row.
Now the graph looks better!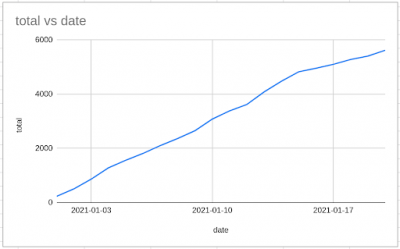
I've manually fiddled with the data, and there are a couple of problems with this. How do I know I've done this right? And how will anybody else who's reviewing my work know what I've done?
And even though the graph now looks better, how do I know I haven't made another mistake, elsewhere in my calculations?
(There's at least one more bug in the spreadsheet: how would you go about finding it?)
I want to talk a bit about how you might deal with these problems using Python.
Example: a Python script with a problem
Python is a very widely used general purpose programming language. It's particularly well suited to data science and data engineering, with a wide range of tools and libraries to help with the problems we face when exploring and analysing data.
Here's a short Python script that contains the same two bugs as the spreadsheet.
import pandas as pd def combine(a, b): combined = pd.Series(0, index=a.index) for col in a.columns: combined = combined.add(a[col], fill_value=0) combined = combined.add(b[col], fill_value=0) return combined.astype(int) if __name__ == "__main__": import sys a = pd.read_csv(sys.argv[1], index_col="date") b = pd.read_csv(sys.argv[2], index_col="date") print(combine(a, b).to_string())We've defined a function called combine, which takes two dataframes as inputs. Think of a dataframe as being a table where the columns are labeled and where the rows are identified by an index. The combine function creates a new series called combined. Think of a series as being like a single column of a dataframe. combined is indexed by the index of the first dataframe, and is initally full of zeroes. Then for each column in the first dataframe, the function adds the values from this column to combined, as well as adding the values from the corresponding column in the second dataframe.
The code after if __name__ == "__main__": tells Python what to do if the script is run from the command line. It reads two CSV files into dataframes, combines them with our function, and displays the output.
Don't worry too much about the implementation here — it's a bit odd in ways that are necessary to produce a good demonstration.
We can run the script giving it the paths to two CSV files, and it attempts to combine them and print out the results:
$ python combine.py A.csv B.csv date 2021-01-01 267 2021-01-02 556 2021-01-03 902 2021-01-04 1452 2021-01-05 1838 2021-01-06 2295 2021-01-07 2723 2021-01-08 2904 2021-01-09 3269 2021-01-10 3926 2021-01-11 4315 2021-01-12 4679 2021-01-13 5184 2021-01-14 5566 2021-01-15 5920 2021-01-16 2712 2021-01-17 2857 2021-01-18 3036 2021-01-19 3161 2021-01-20 3376Here, I'm showing the output of running the script from the command line. A.csv and B.csv are CSV files containing the same data as tabs A and B in the spreadsheet.
One thing to notice about this script is that, unlike the spreadsheet, it just contains code, and the data lives elsewhere. This is important because it means we can easily re-use the code with data from multiple sources, including in our automated tests. (This is possible with spreadsheets, although I've never seen it done.)
Another thing to note is that the script does not make any changes to the input data. This is important because it means that we can run the script without worrying about whether any other part of our analysis depends on the input data.
Testing with a manual spot check
How would we go about testing this script?
The first thing we could do is to cast our eye over the output. We might, if we were feeling awake, notice that there is a drop in the output numbers between 15th January and 16th January. (This would be more obvious if you were to graph the output. There are plenty of graphing packages available for Python.)
Another thing to do would be to do a spot check. We might look at the first rows of the input files, plug the numbers into a calculator, and manually check that the output is what we'd expect.
If we did that here, we'd see that there's a problem.
Here's the first row of A.csv:
2021-01-01,137,11And here's the first row of B.csv:
2021-01-01,83,36,49Adding up the values from each row gives us 137 + 11 + 83 + 36 + 49 = 316. But the value in the first row in the output is 267.
It turns out that this script ignores any columns in the second CSV file that are not present in the first. (And actually it would crash if the second CSV file was missing any columns that were present in the first!)
Automating the spot check
Doing manual spot checks is tedious and error-prone — so we should get the computer to do it.
We can write a test function that does a calculation, and then checks that the calculation returns what we expect.
def test_combine_spot_check(): a = pd.DataFrame( [[10, 20], [20, 30]], columns=["X", "Y"], index=pd.Index(["2021-01-01", "2021-01-02"]) ) b = pd.DataFrame( [[15, 25, 35], [25, 35, 45]], columns=["X", "Y", "Z"], index=pd.Index(["2021-01-01", "2021-01-02"]) ) c = combine(a, b) assert c["2021-01-01"] == 10 + 20 + 15 + 25 + 35First, we construct two dataframes containing test data, called a and b. a has two columns, and b has three. Then we combine them with the combine function, which returns a series we call c. Finally, we assert that the value in the series corresponding to 1st January matches the sum of the values in the first row of a and the first row of b.
We can run the test with a tool called pytest, and when we run pytest, it tells us that the combined value for 1st January does not match what we expect.
$ pytest test_combine.py _____________________ test_combine_spot_check _____________________ Traceback (most recent call last): File "test_combine.py", line 12, in test_combine_spot_check assert c["2021-01-01"] == 10 + 20 + 15 + 25 + 35 AssertionError: assert 70 == 105 ===================== short test summary info ===================== FAILED test_combine.py::test_combine_spot_check ======================== 1 failed in 0.29s ========================#Having written our test and seen it failing as we expect, we can fix the bug. We can change:
for col in a.columns: combined = combined.add(a[col], fill_value=0) combined = combined.add(b[col], fill_value=0)to:
for col in a.columns: combined = combined.add(a[col], fill_value=0) for col in b.columns: combined = combined.add(b[col], fill_value=0)Now when we run pytest, it reports that it ran the test and that the test passed.
$ pytest test_combine.py ======================= test session starts ======================= test_combine.py . [100%] ======================== 1 passed in 0.29s ========================Watching your tests fail
In the same way that it's easy to write buggy production code, it's easy to write buggy test code too.
This pattern is very common:
- write some code
- spot a bug
- write a test that demonstrates the bug
- check the test fails
- fix the bug
- check the test passes
When you do this, it's important that you first check that your new test fails for the reasons that you expect. This gives you confidence that you have actually fixed that bug, and that your new test isn't passing for an unrelated reason.
The value of tests
As demonstrated above, we can use automated tests to give us confidence that we have fixed a bug.
We can also use tests to give us more general confidence in the quality of our code. By writing a test that checks that a function returns what we expect for some particular inputs, we gain confidence that the function behaves as we have intended it to.
As well as giving us — any anybody using our code — confidence in the quality of the code, good tests can help us ensure that we do not introduce bugs in out code as we make changes in future. (Bugs that break existing behaviour are often called "regressions".)
Writing a suite of tests introduces requires up-front work, and at first the value of this extra work may not be obvious. But as the scope and importance of a software project grows, so does the value of a good test suite. Without tests, it becomes harder and harder to be confident that your changes do not introduce new bugs, or cause old bugs to re-emerge.
One further benefit to a test suite is that they can provide a kind of documentation for how your code should be used. Sometimes the best way to explain what a function does is to provide example inputs and outputs — and if you do that, you may as well include these in a test so that you can verify that the given example inputs do indeed produce the expected outputs.
Another bug
Sooner or later, we'll notice that we're not correctly handling the case where the two input files cover different time periods. (This is the first bug we found in the spreadsheet.)
We can take the same approach to testing, by updating our test data, from:
def test_combine_spot_check(): a = pd.DataFrame( [[10, 20], [20, 30]], columns=["X", "Y"], index=pd.Index(["2021-01-01", "2021-01-02"]), ) b = pd.DataFrame( [[15, 25, 35], [25, 35, 45]], columns=["X", "Y", "Z"], index=pd.Index(["2021-01-01", "2021-01-02"]), ) ...to:
def test_combine_spot_check(): a = pd.DataFrame( [[10, 20], [20, 30], [30, 40]], columns=["X", "Y"], index=pd.Index(["2021-01-01", "2021-01-02", "2021-01-03"]), ) b = pd.DataFrame( [[15, 25, 35], [25, 35, 45]], columns=["X", "Y", "Z"], index=pd.Index(["2021-01-01", "2021-01-02"]), ) ...Note the extra row in dataframe a.
We can then do another spot check:
def test_combine_spot_check(): ... assert c["2021-01-03"] == 30 + 40 + 25 + 35 + 45And this spot check fails, because of the bug:
$ pytest test_combine.py _____________________ test_combine_spot_check _____________________ Traceback (most recent call last): File "test_combine.py", line 13, in test_combine_spot_check assert c["2021-01-03"] == 30 + 40 + 25 + 35 + 45 AssertionError: assert 70 == 175 ===================== short test summary info ===================== FAILED test_combine.py::test_combine_spot_check ======================== 1 failed in 0.29s =======================But spot checks are only as good as our imagination, and there's another approach.
Property-based testing
We noticed our first bug in the spreadsheet because the graph looked wrong — the line that was supposed to show the cumulative total went down, which a cumulative total should never do!
More formally, the output of our combine() function should have the property that it never decreases.
We can write a function that returns a boolean value (ie True or False) indicating whether the values in a series satisfy this property:
def never_decreases(s): for k1, k2 in zip(s.index, s.index[1:]): if s[k2] < s[k1]: return False return TrueThis function compares each item in a series with the next item. If any item is less than the one before, then the series has decreased. Otherwise, the series never decreases.
We can then use this function in our test, using the same test data as before:
def test_combine_never_decreases(): a = pd.DataFrame( [[10, 20], [20, 30], [30, 40]], columns=["X", "Y"], index=pd.Index(["2021-01-01", "2021-01-02", "2021-01-03"]), ) b = pd.DataFrame( [[15, 25, 35], [25, 35, 45]], columns=["X", "Y", "Z"], index=pd.Index(["2021-01-01", "2021-01-02"]), ) c = combine(a, b) assert never_decreases(c)We create two dataframes, a and b, combine them to make c, and assert that c never decreases.
And since we haven't fixed the bug yet, the test fails fails:
$ pytest test_combine.py::test_combine_never_decreases __________________ test_combine_never_decreases ___________________ Traceback (most recent call last): File "test_combine.py", line 24, in test_combine_never_decreases assert never_decreases(c) AssertionError: assert False ===================== short test summary info ===================== FAILED test_combine.py::test_combine_never_decreases ======================== 1 failed in 0.29s ========================But we're only testing for a single set of inputs. What if we could generate lots of inputs, and assert that this property holds for all of them?
Automagically generating inputs
This is where a tool called Hypothesis comes in. Not only will Hypothesis run a test lots of time with lots of different inputs, if it finds an input that causes the test to fail, it will attempt to find the simplest possible input that does so.
First, we have to tell Hypothesis how to generate suitable inputs.
import hypothesis.strategies as st @st.composite def cumsum(draw): num_rows = draw(st.integers(min_value=1, max_value=20)) num_cols = draw(st.integers(min_value=1, max_value=5)) index = [f"2021-01-{i+1:02}" for i in range(num_rows)] columns = ["A", "B", "C", "D", "E"][:num_cols] raw_values = [ [ draw(st.integers(min_value=0, max_value=100)) for _ in range(num_cols) ] for _ in range(num_rows) ] raw_df = pd.DataFrame(raw_values, columns=columns, index=index) return raw_df.cumsum()
This is a "strategy" for generating suitable dataframes that have between 1 and 20 rows and between 1 and 5 columns. The function first picks, at random, the number of rows (num_rows) and number of columns (num_cols). It then builds an intermediate dataframe (raw_df) that has num_rows rows and num_cols cols, with each value being an integer chosen at random between 0 and 100. Finally, it generates a new dataframe containing the cumulative sums of the columns in raw_df.
We can ask Hypothesis to show us examples of what it can generate with this strategy:
>>> cumsum().example() A B C D E 2021-01-01 8 96 81 50 97 2021-01-02 41 139 168 125 124 2021-01-03 71 145 192 222 162 2021-01-04 73 202 230 315 212 2021-01-05 161 264 289 395 300 2021-01-06 217 313 337 441 387 >>> >>> cumsum().example() A 2021-01-01 0 >>> >>> cumsum().example() A B 2021-01-01 55 34 2021-01-02 147 119 2021-01-03 213 124Here, I'm running code interactively using the Python interpreter. Note that each example is different: Hypothesis can generate examples covering a range of complexities.
Then we can update test_combine_never_decreases so that instead of the test data that we created ourselves, it uses the data generated by Hypothesis:
from hypothesis import given @given(a=cumsum(), b=cumsum()) def test_combine_never_decreases(a, b): combined = combine(a, b) assert never_decreases(combined)When we run the test, Hypothesis finds an input that causes the assertion to fail. That is, it finds a pair of dataframes whose combination does not satisfy the property that the values never decrease.
$ pytest test_combine.py::test_combine_never_decreases __________________ test_combine_never_decreases ___________________ Traceback (most recent call last): File "test_combine.py", line 38, in test_combine_never_decreases assert never_decreases(c) AssertionError: assert False -------------------------- Hypothesis ----------------------------- Falsifying example: test_combine_never_decreases( a= A 2021-01-01 1 , b= A 2021-01-01 0 2021-01-02 0 , ) ===================== short test summary info ===================== FAILED test_combine.py::test_combine_never_decreases ======================== 1 failed in 0.29s ========================We can verify that these inputs do produce an output that does not satisfy the expected property:
>>> import pandas as pd >>> from combine import combine >>> >>> a = pd.DataFrame([1], columns=["A"], index=["2021-01-01"]) >>> b = pd.DataFrame([0, 0], columns=["A"], index=["2021-01-01", "2021-01-02"]) >>> combine(a, b) 2021-01-01 1 2021-01-02 0Again, I'm running code with the Python interpreter.
What's interesting is that not only has Hypothesis generated inputs that cause our test to fail, but that it has found the simplest possible input that does so. To do this it generates a lot of different inputs, and when it finds an input that causes a test to fail, it tries different ways to simplify the input.
(Note that Hypothesis isn't actually magic: if a bug is only triggered by a very precise set of inputs, Hypothesis might not find them.)
We can fix the bug:
def combine(a, b): combined = pd.Series(0, index=a.index | b.index) for col in a.columns: combined = combined.add(a[col], fill_value=a[col][-1]) for col in b.columns: combined = combined.add(b[col], fill_value=b[col][-1]) return combined.astype(int)When adding two series together, fill_value is used by Pandas to replace any values from one series that are missing from the other. We have changed fill_value=0 (which replaces a missing value with zero) by fill_value=a[col][-1] (which replaces a missing value with the last value in the column).
And now the test passes:
$ pytest test_combine.py::test_combine_never_decreases ======================= test session starts ======================= test_combine.py . [100%] ======================== 1 passed in 0.29s ========================Tradeoffs
While property-based testing is a very powerful tool, it is rarely the first tool I reach for. Spot checks are easy to write and are usually easy to understand, while using a tool like Hypothesis can add significant mental overhead, especially when you are new to automated testing.
Writing a good suite of spot check tests will give you a lot of confidence in your code, and will be invaluable for detecting regressions as your code changes over time.
However, you can only use spot checks to check examples that you have thought of yourself. This can become time consuming, and you are likely to leave whole classes of inputs untested. Depending on the complexity of the code under test and the importance of the analysis, this may well be an acceptable tradeoff, but it is a tradeoff you might want to consider.
That said, any kind of automated testing is infinitely better than no automated testing, and so if you practice spot check testing, you will be doing a lot more than most (or nearly all? — I don't have any data here) researchers who write software.
Summing up
This blog post is intended to demonstrate some of the tools that are available for giving us confidence that our Python code is correct.
We can never guarantee that our code is free of bugs. In fact, it's often hard to know what kind of behaviour should be classed as a bug. And in different situations, the cost of bugs will be different, and there will be different tradeoffs against the cost of fixing bugs.
When starting out, it can be very difficult to know how to start testing your code. It can be tricky to know what good tests look like, and it can be hard to judge how much effort to put into testing.
The only real solution to these problems like these is to practice. But the pay-off is the confidence — for yourself and for anybody relying on your work — that your code more-or-less does what you think it should!
If you have any questions, please do get in touch by email: peter.inglesby@gmail.com.
Exercises
These exercises require some experience with Python.
I'm fairly sure that the code can now correctly handle the case where the two inputs start on the same day. But the code won't correctly handle the case where the two inputs start on different days:
>>> a = pd.DataFrame( [1, 2], columns=["A"], index=["2021-01-01", "2021-01-02"] ) >>> b = pd.DataFrame( [10, 20], columns=["A"], index=["2021-01-02", "2021-01-03"] ) >>> combine(a, b) 2021-01-01 21 2021-01-02 12 2021-01-03 22- Make sure you understand what the bug is.
- Can you write a spot check test that demonstrates the failure?
- Can you update the cumsum strategy so that Hypothesis can find a failing example?
- Can you fix the code so that the tests pass?
- Can you write an alternative implementation of combine, and use Hypothesis to verify that both implementations give the same result?
Appendix: resources for learning Python
- Automate the Boring Stuff with Python. A book about learning Python by learning how to use it for practical tasks such as managing files, scraping web pages, and working with spreadsheets.
- Learn Python the Hard Way. A book about learning Learn Python through repetitive exercises, inspired by learning a musicalinstrument. Not to everyone's taste!
- Codecademy. An online course for learning the basics of Pytohn.
- The Python Data Science Handbook. A book about the Python tools for manipulating data, producing graphs, and running machine learning algorithms.
- Test-Driven Development with Python. A very opinionated book about one approach to testing Python applications, with a focus on web applications.