Learning to Code: My Experience as a Psychology Graduate
Learning to Code: My Experience as a Psychology Graduate
By Amirah Khan.
This blog post is part of the series of resources on learning to code, hosted as part of the Research Software Camp: Beyond the Spreadsheet.
I took part in the ‘learning to code’ programme as part of the ‘Beyond the Spreadsheet’ Research Software Camp. I was mentored by Sadie Bartholomew, a Research Software Engineer who guided me through learning Python. I’ll share my reasons for volunteering, an overview of my project, and my journey throughout the programme.
Why did I volunteer?
As a Psychology graduate, I’m familiar with the use of spreadsheets for storing and manipulating data before performing statistical analysis. Recently, I completed a neuroscience-based research internship and was introduced to the UNIX command line, scripting, and R. This experience taught me how programming skills can be applied to research and introduced me to the field of Research Software Engineering. I previously studied Computer Science at A-level and was excited to know I could use such skills in the field of psychology and neuroscience. This mentoring opportunity seemed like the perfect way to learn more and get involved.
Project Overview
For my project, I learnt Python with my mentor and focused on manipulating data stored in spreadsheets. I wanted to automate the data manipulation processes that I utilised throughout my degree and internship. Specifically, I used a dataset that stored the size of specific brain areas and lesions in voxels. This data was used to calculate the proportion of brain area that was affected by the lesion. My project aimed to (a) reorganise the large dataset into smaller worksheets based on each brain area, and (b) automate the calculation for the proportion that was affected. I achieved this by using a Python library called openpyxl which allows for reading and writing Excel files.
Project Roadmap & Challenges
Choosing the Project
First, I discussed psychology based topic ideas with my mentor as this was my area of interest. My mentor introduced the openpyxl library to me and based on my psychology experience, I decided I wanted to automate data manipulation processes. At this stage, we needed a dataset and after some research, we concluded using a dataset I was already familiar with was the best option.
Learning Python Basics
My mentor shared a range of resources and tutorials with me so that I could familiarise myself with the basics of Python. I went through the resources and chose PyCharm as my IDE. I learnt about Python variables, data types and conversion, objects, logical operators, if statements, while loops, lists, for loops, and functions. I enjoyed learning a new language and completing the tutorial exercises.
Learning openpyxl
Next, I moved onto the openpyxl tutorials and resources. I learnt how to do a range of things from installing the library, to loading up workbooks, accessing worksheets and their cell values. These tutorials showed how to loop through rows in a worksheet and append new data. In theory, this was easy to understand but I wasn’t sure exactly how to apply this to my project yet.
Plan of Action
My mentor supported me to put a step by step plan together using what I know about Python and openpyxl. I decided first I need to load up the workbook and access the relevant worksheets. My first goal was to access the data I needed for the affected proportion calculation and write the result into the relevant column. After this, I wanted to attempt the more complex task of reorganising the spreadsheet. This plan helped me to break things down and avoid getting overwhelmed.
Coding the Project
Now, it was time to actually code the project and put my knowledge into practise. The plan helped me get started with the basics of loading up my workbook, worksheets and creating a loop for iterating through each row of data. However, it took some more research to figure out how to use the spreadsheet data to perform a calculation that would then be written back. I used the openpyxl documentation and some examples online to figure this out. Later, my mentor helped me to approach those tasks from a different angle and gave me a tutorial. This helped me to see how I could apply both my Python and openpyxl knowledge to tackle my goals. I found working on the problem myself first and then discussing it with my mentor helped to fill the gaps in my knowledge.
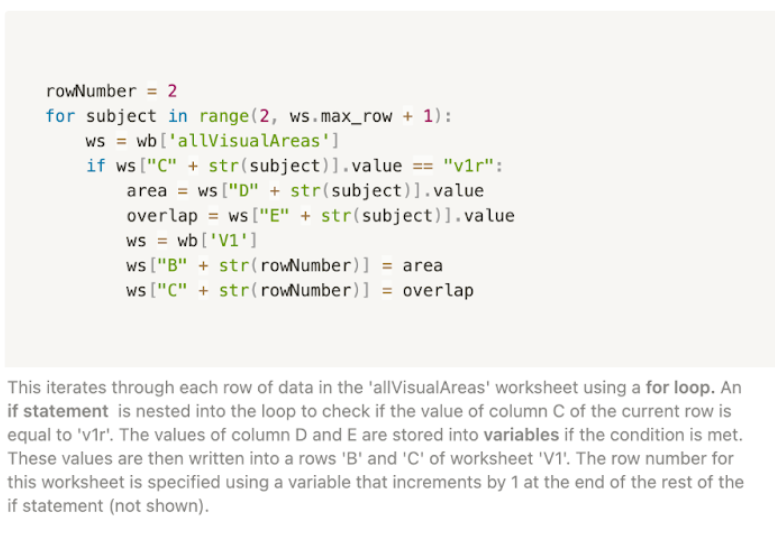
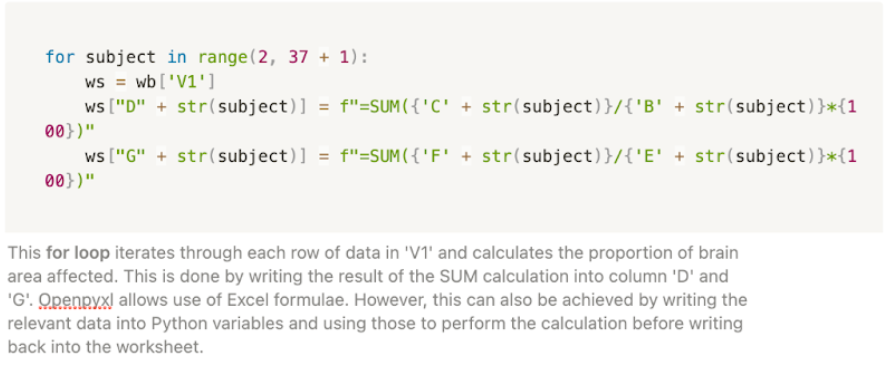
The Final Product
To organise the data by brain area, I used an if statement nested in a for loop. For the proportion affected calculation, I used a for loop and excel function. I also learnt how to do this using Python variables rather than an excel function. This means I’ll have more flexibility when manipulating future data. You can see some snippets and explanations of the final code below:
This programme was a valuable learning experience, and has encouraged me to continue to learn more about the field of Research Software Engineering, especially within the area of Psychology. You can keep up to date on my coding journey here.